|

UK Index Summary
| Close | Volume | 1 day Change | P&F Trend | Stop | |||||
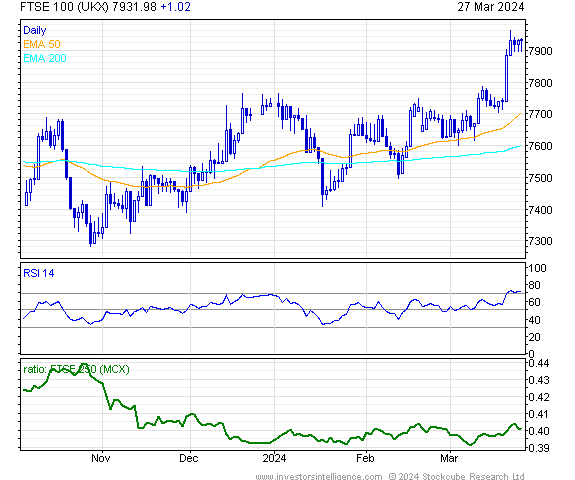
| FTSE 100 | 7931.98 | 0 | +1.02 | +0.0% | Bull  |
14 Dec 2023 | 7450.00 | ||
| FTSE 250 | 19810.7 | 0 | +33.02 | +0.2% | Bull |
22 Feb 2024 | 19500.00 | ||
| FTSE SmallCap Index | 6354.94 | 0 | +19.09 | +0.3% | Bull |
14 Nov 2023 | 6250.00 | ||
| FTSE All Share | 4177.42 | 0 | +3.14 | +0.1% | Bull  |
16 Feb 2024 | 4080.00 | ||
| Closing prices through Tue Mar 5, 2024 | |||||||||
Chart of the Day
UK Indices
Bulls
Bears
UK Equity Trading (long/short): Longs
| Date | Stock | Code | Type | Open Price | Current Price | % P&L | Target | Stop |
|---|---|---|---|---|---|---|---|---|
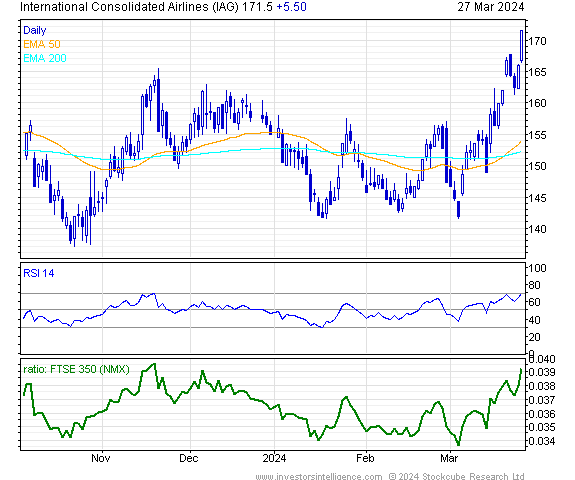
| 23 Nov 2022 | Rolls-Royce Group PLC | RR/ | Long | 88.41 | 422 | +377.32% | 110 | 72 |
| 2 Feb 2023 | Marks & Spencer Group PLC | MKS | Long | 161.05 | 265.9 | +65.10% | 200 | 140 |
| 3 Jul 2023 | Investec PLC | INVP | Long | 449.6 | 530.4 | +17.97% | 550 | 410 |
| 4 Jul 2023 | Segro PLC | SGRO | Long | 740.6 | 892 | +20.44% | 850 | 675 |
| 31 Aug 2023 | Sage Group PLC | SGE | Long | 971 | 1263.5 | +30.12% | 1100 | 850 |
| 8 Sep 2023 | Computacenter PLC | CCC | Long | 2486 | 2694 | +8.37% | 3000 | 2250 |
| 8 Sep 2023 | Pearson PLC | PSON | Long | 881.8 | 1035 | +17.37% | 1000 | 810 |
| 14 Sep 2023 | Virgin Money | CYBG | Long | 170.6 | 213.6 | +25.21% | 220 | 150 |
| 14 Sep 2023 | Cranswick Plc | CWK | Long | 3572 | 4116 | +15.23% | 4200 | 3200 |
| 3 Nov 2023 | Beazley Group PLC | BEZ | Long | 539 | 671.5 | +24.58% | 625 | 486 |
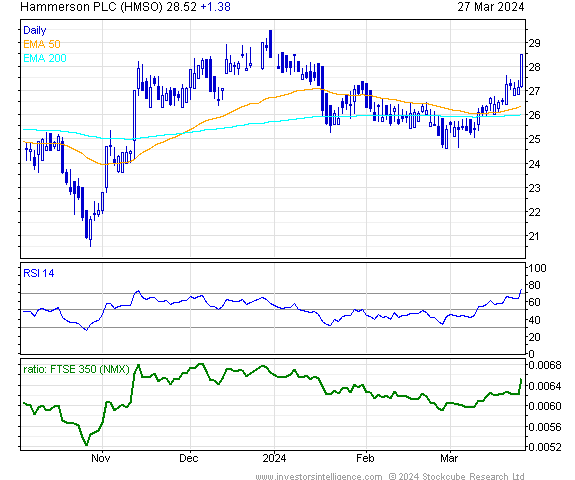
| 3 Nov 2023 | Lloyds Banking Group PLC | LLOY | Long | 42.435 | 51.67 | +21.76% | 55 | 37 |
| 8 Nov 2023 | Tate & Lyle PLC | TATE | Long | 655.5 | 620 | -5.42% | 750 | 590 |
| 13 Nov 2023 | BP PLC | BP/ | Long | 484.7 | 492.8 | +1.67% | 550 | 445 |
| 13 Nov 2023 | M&G PLC | MNG | Long | 207.6 | 234.8 | +13.10% | 250 | 185 |
| 4 Jan 2024 | Tesco PLC | TSCO | Long | 302.4 | 298.2 | -1.39% | 330 | 270 |
| 4 Jan 2024 | United Utilities PLC | UU/ | Long | 1063.5 | 1045.5 | -1.69% | 1150 | 950 |
| 26 Jan 2024 | Prudential PLC | PRU | Long | 858.2 | 755.8 | -11.93% | 1000 | 775 |
| 26 Jan 2024 | Croda International PLC | CRDA | Long | 4756 | 4853 | +2.04% | 6000 | 4250 |
| 29 Jan 2024 | Easyjet PLC | EZJ | Long | 547.2 | 557.6 | +1.90% | 600 | 510 |
| 5 Feb 2024 | Babcock International Group | BAB | Long | 462 | 532 | +15.15% | 600 | 425 |
| 9 Feb 2024 | Informa PLC | INF | Long | 799 | 837.4 | +4.81% | 900 | 740 |
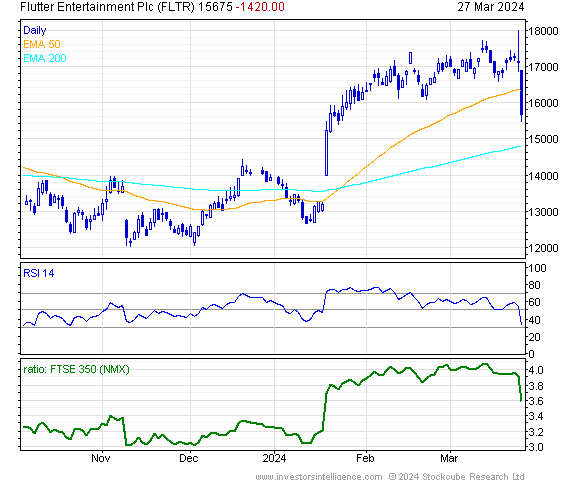
| 22 Mar 2024 | London Stock Exchange Group | LSEG | Long | 9652 | 9592 | -0.62% | 11000 | 8500 |
| 22 Mar 2024 | NatWest Group Plc | NWG | Long | 261.1 | 262.8 | +0.65% | 300 | 235 |
UK Equity Trading (long/short): Shorts
| Date | Stock | Code | Type | Open Price | Current Price | % P&L | Target | Stop |
|---|---|---|---|---|---|---|---|---|
| 14 Jun 2023 | Hays PLC | HAS | Short | 102.1 | 94 | +7.93% | 75 | 115 |
| 6 Jul 2023 | Telecom Plus Plc | TEP | Short | 1646 | 1606 | +2.43% | 1250 | 1850 |
| 8 Nov 2023 | Pennon Group PLC | PNN | Short | 723.5 | 656 | +9.33% | 650 | 800 |
| 2 Jan 2024 | St James's Place PLC | STJ | Short | 658.8 | 452.3 | +31.34% | 500 | 750 |
| 2 Jan 2024 | Pets at Home Group Plc | PETS | Short | 309.4 | 270 | +12.73% | 250 | 350 |
| 4 Jan 2024 | Anglo American PLC | AAL | Short | 1873.2 | 1922.8 | -2.65% | 1500 | 2150 |
| 17 Jan 2024 | Fresnillo | FRES | Short | 487.9 | 457 | +6.33% | 400 | 550 |
| 17 Jan 2024 | Big Yellow Group Plc | BYG | Short | 1107 | 1057 | +4.52% | 1000 | 1200 |
| 28 Feb 2024 | Genus | GNS | Short | 1830 | 1787 | +2.35% | 1500 | 2050 |
Recommend a friend! Tell your friends to mention your name when subscribing to Investors Intelligence, and get a months free access to a service of your choice! For more information, email support@investorsintelligence.com. Content also available online at www.investorsintelligence.com. Unauthorized forwarding, copying or reproduction of this report will be treated as a breach of copyright. To subscribe, visit the website or contact Investors Intelligence on +44 (0)20 7352 4001 or email support@investorsintelligence.com.
This report has been produced and compiled by Investors Intelligence, a division of Stockcube Research Limited which is authorised and regulated by the Financial Conduct Authority. It is distributed by Stockcube and is provided for information purposes only. Under no circumstances is it to be used or considered as an offer to sell, or a solicitation of any offer to buy. While all reasonable care has been taken to ensure that the information contained herein is not untrue or misleading at the time of publication, we make no representation as to its accuracy or completeness and it should not be relied upon as such. From time to time Stockcube and any of its officers or employees may, to the extent permitted by law, have a position or otherwise be interested in any transactions, in any investments (including derivatives) directly or indirectly the subject of this report. Also Stockcube may from time to time perform other services (including acting as adviser or manager) for any company mentioned in this report. The value of securities can go down as well as up, and you may not get back the full amount you originally invested. Derivatives in particular are high risk, high reward investment instruments and an investor may lose some or all of his/her original investment. If you make an investment in securities that are denominated in a currency other than that of GB Pounds you are warned that changes in rates of foreign exchange may have an adverse effect on the value, price or income of the investment. The investments referred to herein may not be suitable investments for all persons accessing these pages. You should carefully consider whether all or any of these are suitable investments for you and if in any doubt consult an independent adviser. This report is prepared solely for the information of clients of Stockcube who are expected to make their own investment decisions without reliance on this report. Neither Stockcube nor any officer of Stockcube accepts any liability whatsoever for any direct and consequential loss arising from use of this report or its contents. This report may not be reproduced, distributed or published by any recipient for any purpose without the prior express consent of Stockcube.
Copyright 2020 by Stockcube Research Ltd.
%%webbug